Quote:
Originally Posted by Pete_89T2

Barry - were those wall temp curves something you generated yourself through testing or were they found in a reference somewhere? Would be cool if someone with an ample supply of housings, appropiate test equipment and skills could rig up a test to do a comparitive evaluation of these techniques. What I'm thinking is the housing can be installed in a test jig that allows coolant to flow through at a controlled rate. A torch or similar localized heat source to heat the area of the plug holes on the housing, which would be instrumented to measure & map the temperature distribution of heat applied. Then simultaneously measure & map coolant temps as was apparently done to generate those curves. The curves would then answer which technique or combination nets the best result.
|
Wow! Lots of replies.
Pete that wall temp diagram is from Yamamotos book, but it is very similar to those in the NSU and Mercedes papers.
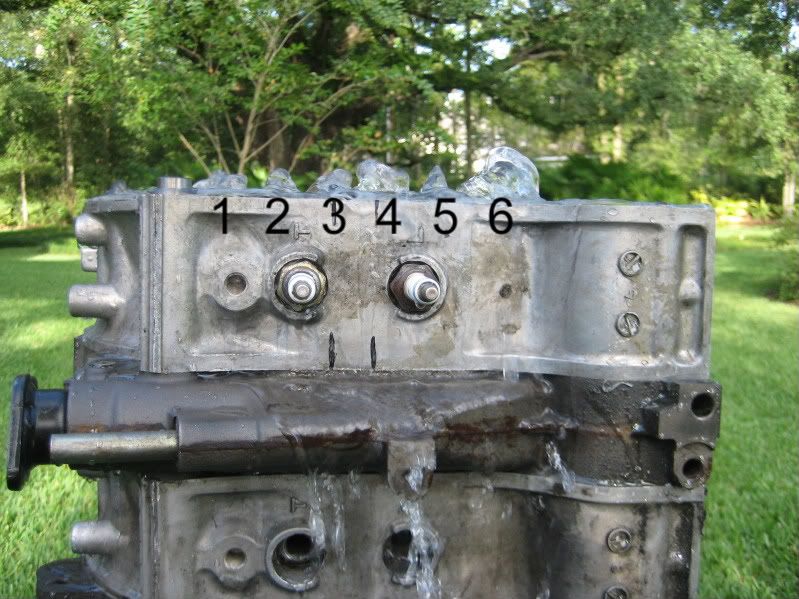
What I would like you all to do is to go out into your garage and grab an old housing.
Now examine the water passages around the periphery. You can see how Mazda is trying to balance heat in the housing.
Their plan was disrupted by the plug move.
Now look back at that picture of the water flowing through the housing.
Do you really want to flow more water though section #6 which by its size is depriving flow through #5?
If you think higher velocity is the answer than restrict #6.
We are not going to run out of flow. It increases with RPM to the point of pump cavitation (for me around 7400rpm).
I realize this information is not for everyone. It will only be logical to some. It is really for those guys in the background who are quietly trying to build more dependability into their engines. You know who you are.
Barry